One common research purpose in metabolomics is to check the relations among the metabolites. Correlation network is one of the most popular way to show such relations. However, such network will change with different selection of the cutoff of correlation coefficients.
Let’s check some real world data.
library(pmd)
library(enviGCMS)
data(spmeinvivo)
# remove redundant peaks
newmet <- globalstd(spmeinvivo)
## 75 retention time cluster found.## 369 paired masses found## 5 unique within RT clusters high frequency PMD(s) used for further investigation.## The unique within RT clusters high frequency PMD(s) is(are) 28.03 21.98 44.03 17.03 18.01.## 719 isotopologue(s) related paired mass found.## 492 multi-charger(s) related paired mass found.## 8 retention group(s) have single peaks. 14 23 32 33 54 55 56 75## 11 group(s) with multiple peaks while no isotope/paired relationship 4 5 7 8 11 41 42 49 68 72 73## 9 group(s) with multiple peaks with isotope without paired relationship 2 9 22 26 52 62 64 66 70## 4 group(s) with paired relationship without isotope 1 10 15 18## 43 group(s) with paired relationship and isotope 3 6 12 13 16 17 19 20 21 24 25 27 28 29 30 31 34 35 36 37 38 39 40 43 44 45 46 47 48 50 51 53 57 58 59 60 61 63 65 67 69 71 74## 291 std mass found.metabolites <- getfilter(spmeinvivo,rowindex = newmet$stdmassindex)Originally we have 1459 peaks. After removal of redundant peaks such as isotope, adducts and Neutral losses by globalstd algorithm, we have 291 peaks as the number of potential metabolites. To check their relations, we will calculate the paired correlation coefficients among their intensities.
metcor <- cor(t(metabolites$data))Let’s check the distribution of correlation coefficients:
hist(metcor)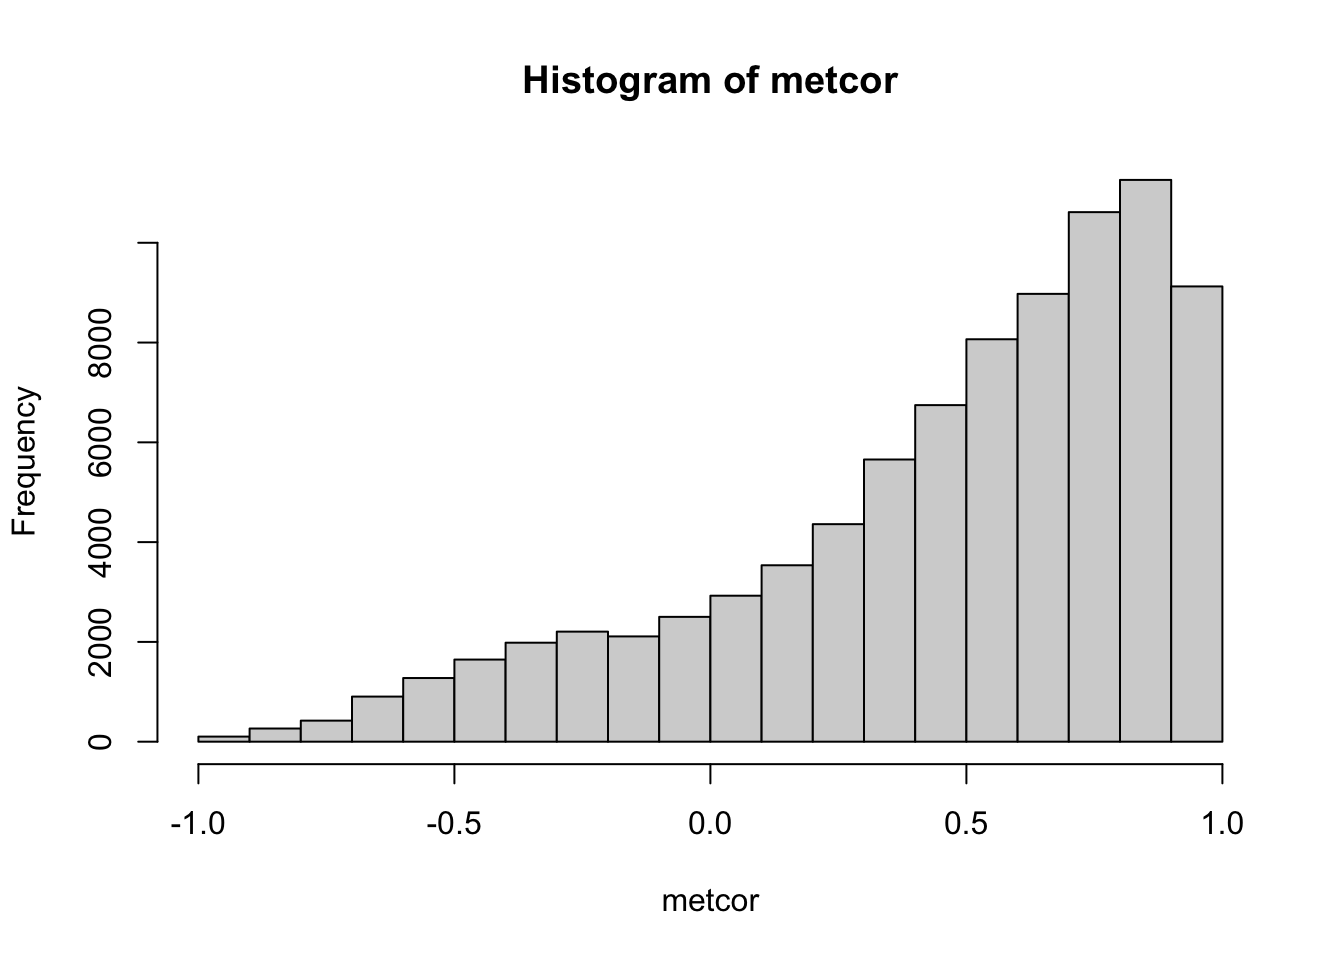
Since correlation coefficients are also associated with a p value, we can also check the distribution of p values.
cor.test.p <- function(x){
    FUN <- function(x, y) cor.test(x, y)[["p.value"]]
    z <- outer(
      colnames(x),
      colnames(x),
      Vectorize(function(i,j) FUN(x[,i], x[,j]))
    )
    dimnames(z) <- list(colnames(x), colnames(x))
    z
}

pmat <- cor.test.p(t(metabolites$data))
hist(pmat)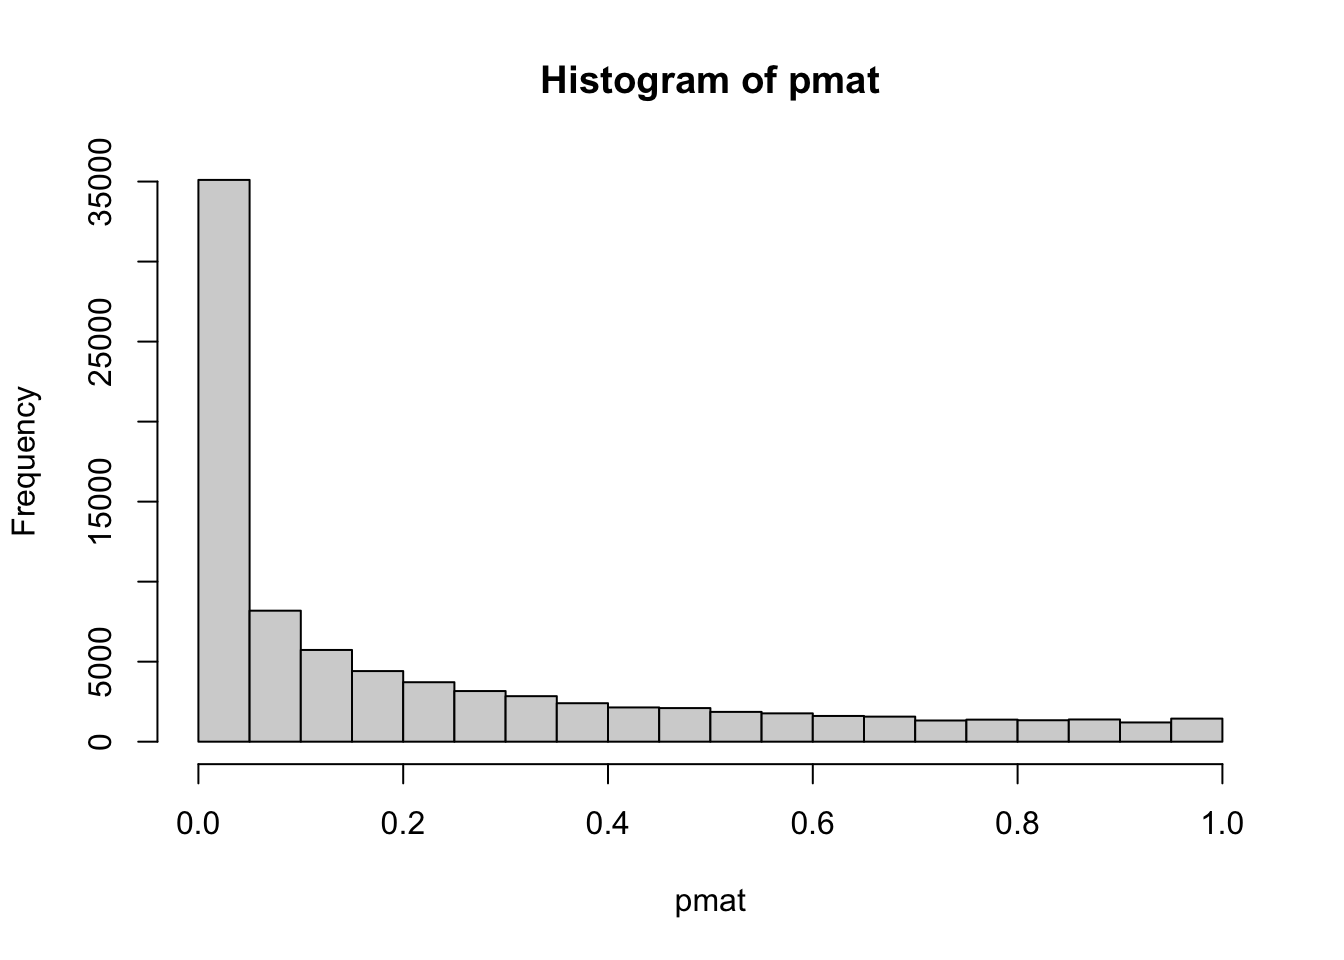
sum(pmat<0.05)/length(pmat)## [1] 0.414541% original p values are less than 0.05. We can filter the correlation coefficients based on this rule.
metcor2 <- metcor[pmat<0.05]
hist(metcor2)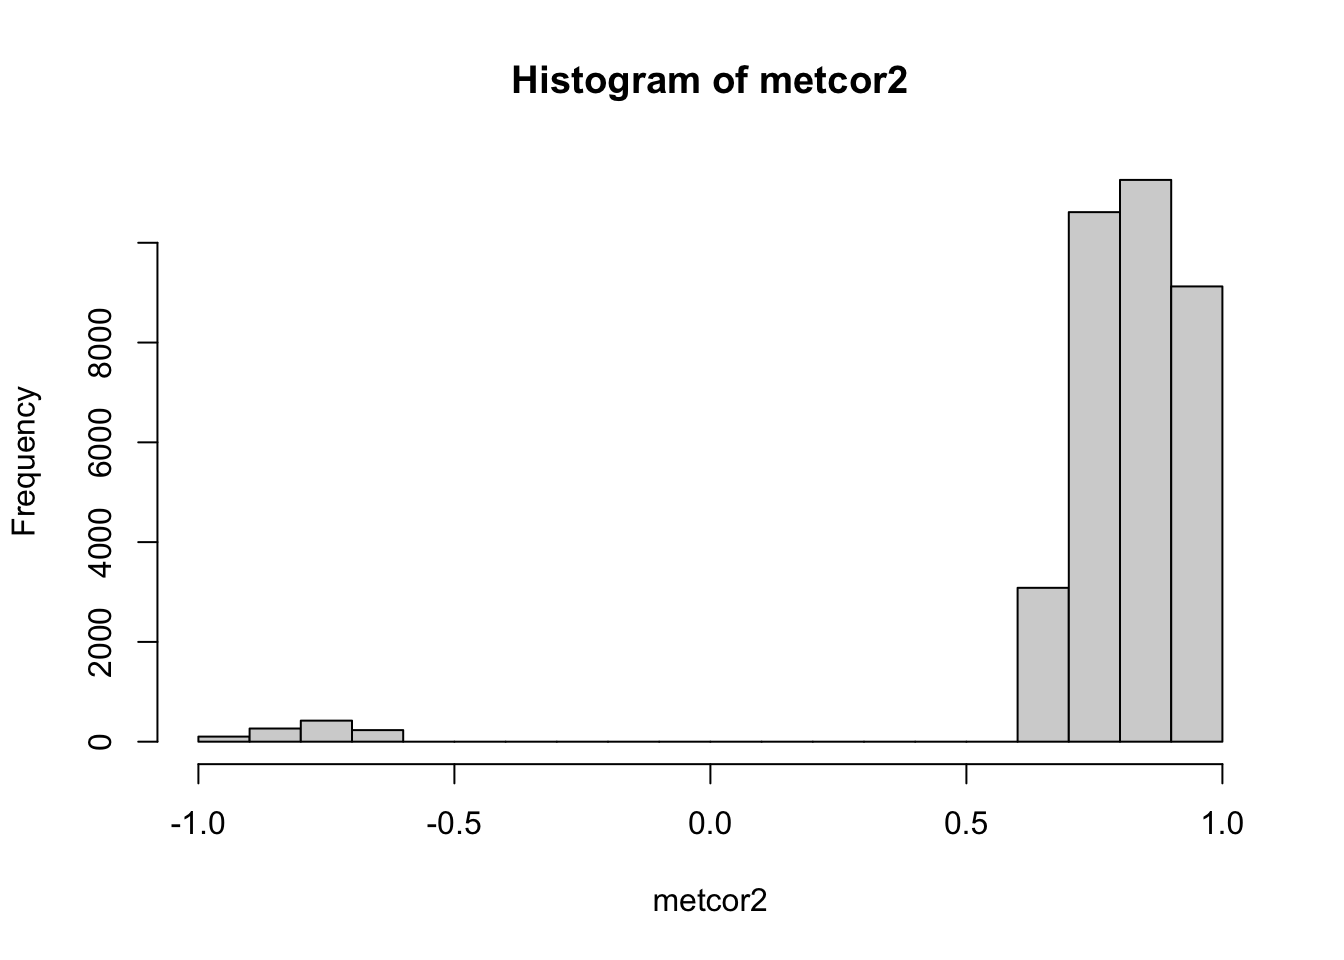
range(abs(metcor2))## [1] 0.6664 1.0000Here we can find the cutoff is around +/-0.67. However, we didn’t perform FDR control. If we use BH method to correct the p value, we will have a different cutoff.
pmat_adj <- p.adjust(pmat)
metcor3 <- metcor[pmat_adj<0.05]
range(abs(metcor3))
## [1] 0.9881 1.0000Now the cutoff is 0.99. We can display the data as network:
metcor[pmat>=0.05] <- 0
library(igraph)
##
## Attaching package: 'igraph'## The following objects are masked from 'package:stats':
##
## decompose, spectrum## The following object is masked from 'package:base':
##
## unionnet <- graph.adjacency(metcor,weighted=TRUE,diag=FALSE,mode = 'undirected')
plot(net,vertex.size=1,edge.width=1,vertex.label="")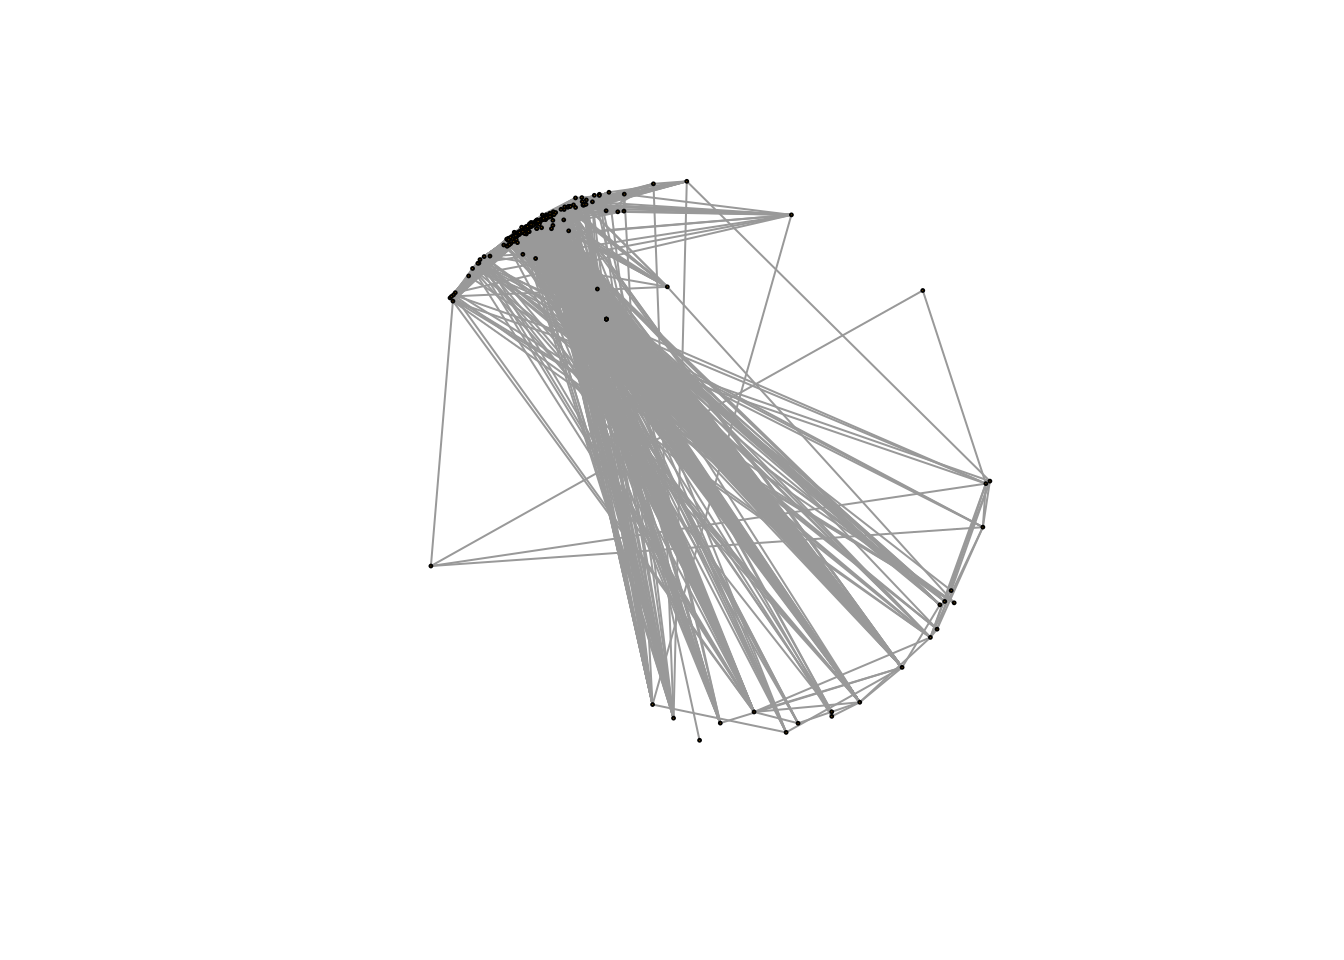
Here it seems all metabolites are connected and FDR control will solve this issue.
metcor <- cor(t(metabolites$data))
metcor[pmat_adj>=0.05] <- 0
net <- graph.adjacency(metcor,weighted=TRUE,diag=FALSE,mode = 'undirected')
plot(net,vertex.size=1,edge.width=1,vertex.label="")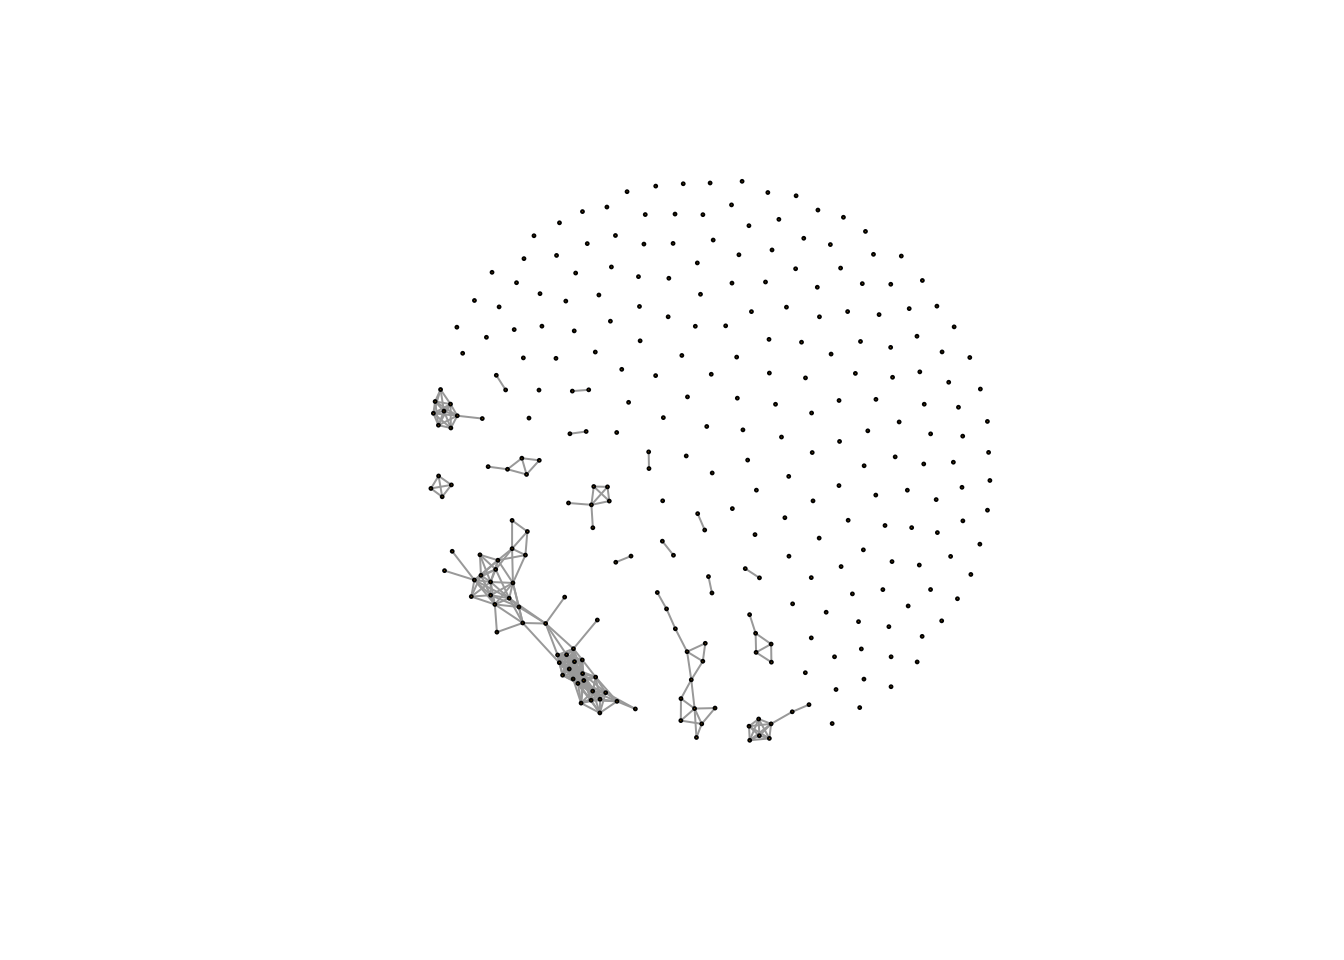
Here we will see the networks with few large clusters and lots of single metabolites without any association with each other.
If we didn’t consider the p values, we can also check the networks with different cutoffs.
n <- c()
for (i in seq(0,1,0.1)) {
        metcor <- cor(t(metabolites$data))
        metcor[metcor<i] <- 0
        net <- graph.adjacency(metcor,weighted=TRUE,diag=FALSE,mode = 'undirected')
        # plot(net,vertex.size=1,edge.width=1,vertex.label="")
        cn <- components(net)
        # check the numbers of cluster
        n <- c(n,length(table(membership(cn))[table(membership(cn))>1]))
}
plot(seq(0,1,0.1),n,xlab='cutoff',ylab = 'cluster number',type = 'l')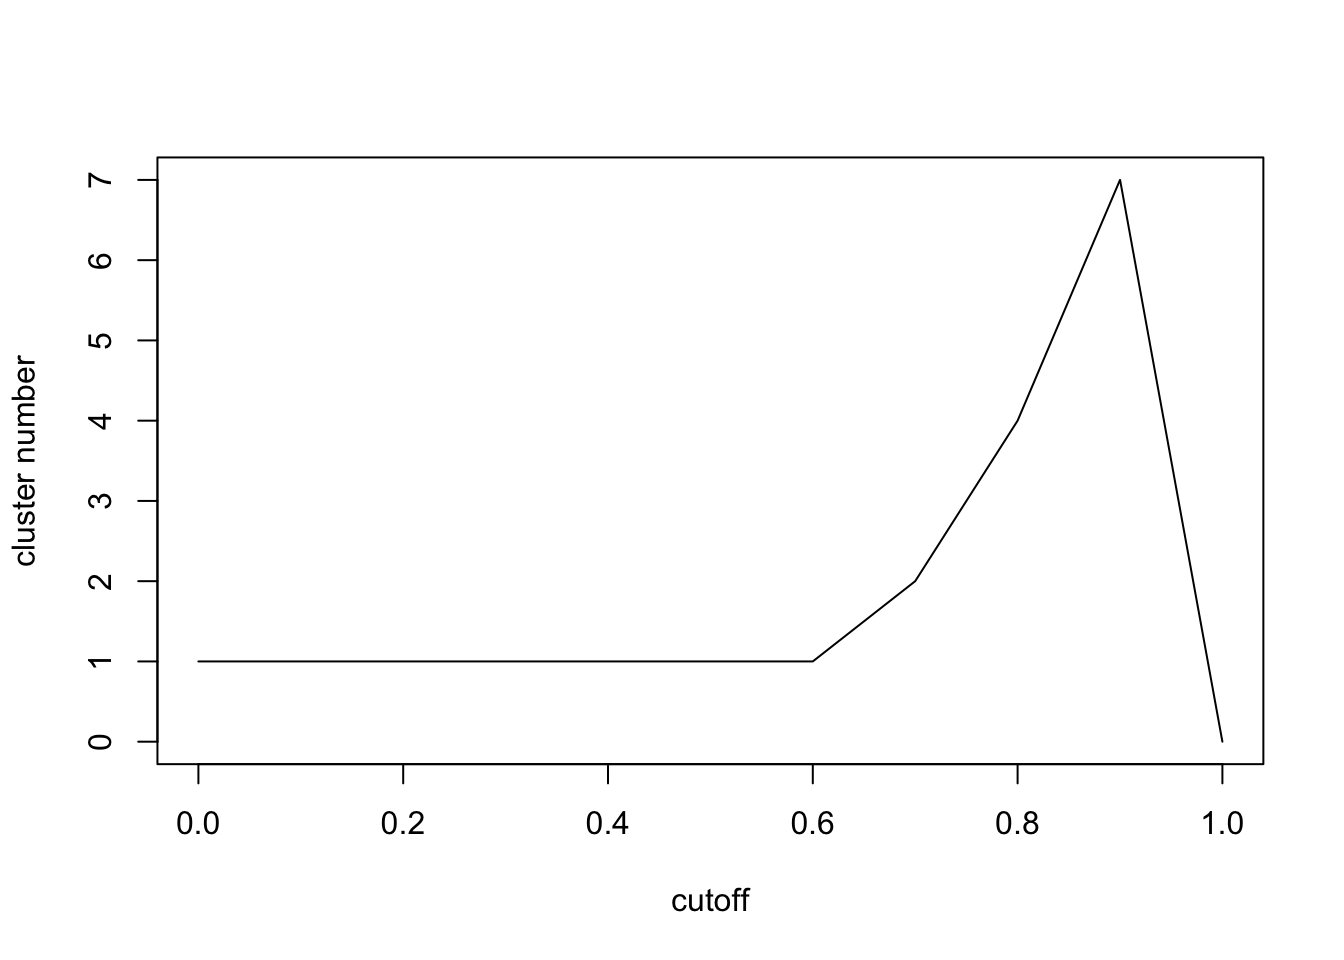
Here we can see the cluster numbers will firstly increase and then decrease. Let’s check \[0.8,1\] carefully.
n <- c()
for (i in seq(0.8,1,0.001)) {
        metcor <- cor(t(metabolites$data))
        metcor[metcor<i] <- 0
        net <- graph.adjacency(metcor,weighted=TRUE,diag=FALSE,mode = 'undirected')
        # plot(net,vertex.size=1,edge.width=1,vertex.label="")
        cn <- components(net)
        # check the numbers of cluster
        n <- c(n,length(table(membership(cn))[table(membership(cn))>1]))
}
plot(seq(0.8,1,0.001),n,xlab='cutoff',ylab = 'cluster number',type = 'l')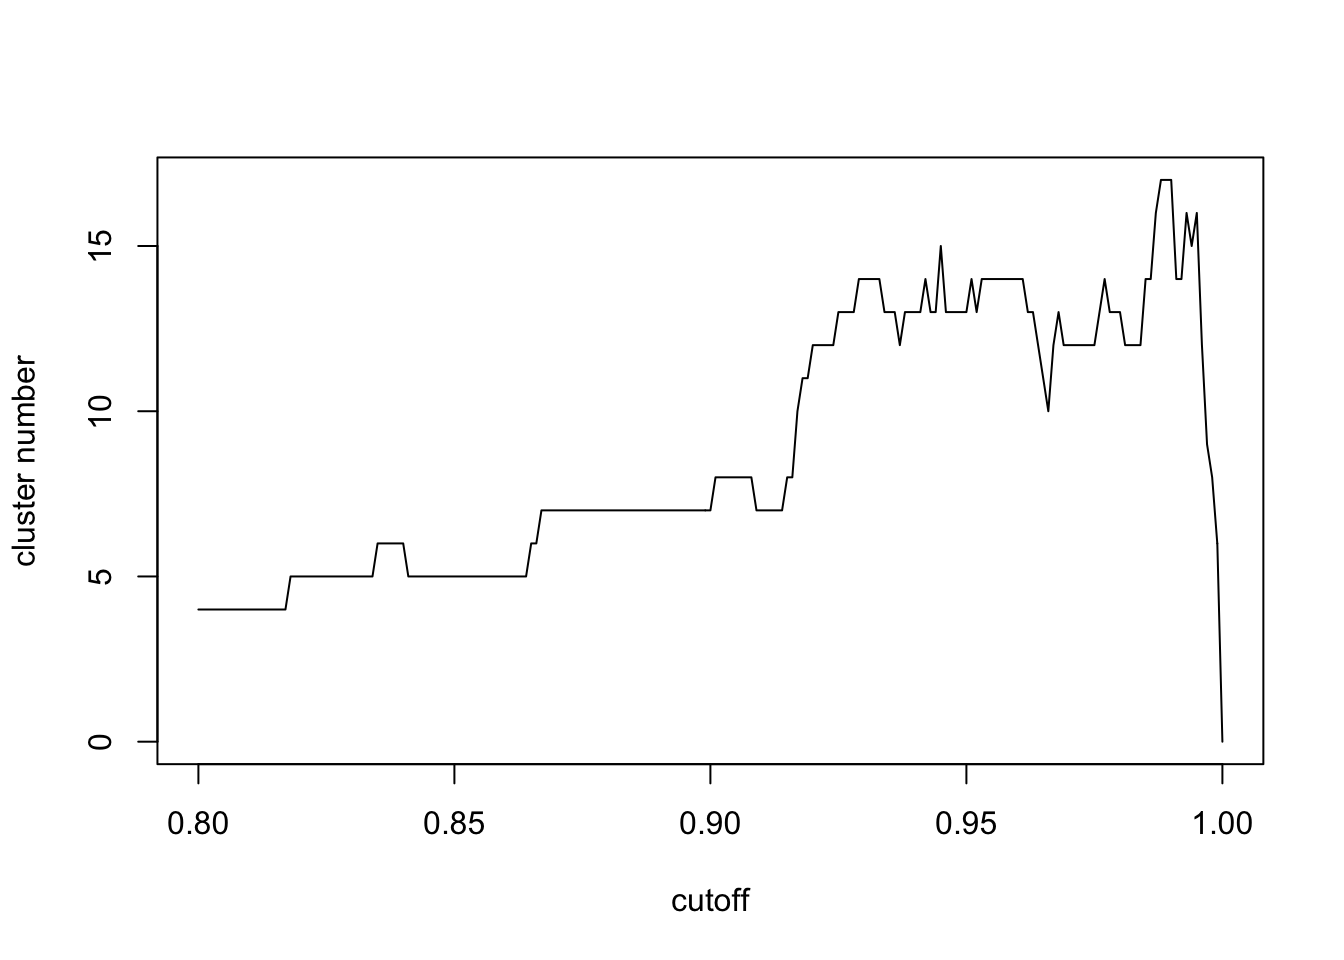
# display the cutoff
seq(0.8,1,0.001)[which.max(n)]
## [1] 0.988Here we find the max number of network clusters has a similar cutoff of p value cutoff with FDR control. However, the computation process is much faster. When the cutoff is small, all metabolites are connected. When the cutoff is large, few metabolites will be covered. In terms of physics, largest number of network clusters means the coverage of largest numbers of connected metabolites with largest clusters separations. I think this should be the fastest way to select cutoff from the real world data.
Actually, I add a function called `getcf()` into `enet` package to automate find this cutoff of correlation network analysis. Here is the network for our demo data:
metcor <- cor(t(metabolites$data))
metcor[metcor<seq(0.8,1,0.001)[which.max(n)]] <- 0
net <- graph.adjacency(metcor,weighted=TRUE,diag=FALSE,mode = 'undirected')
plot(net,vertex.size=1,edge.width=1,vertex.label="")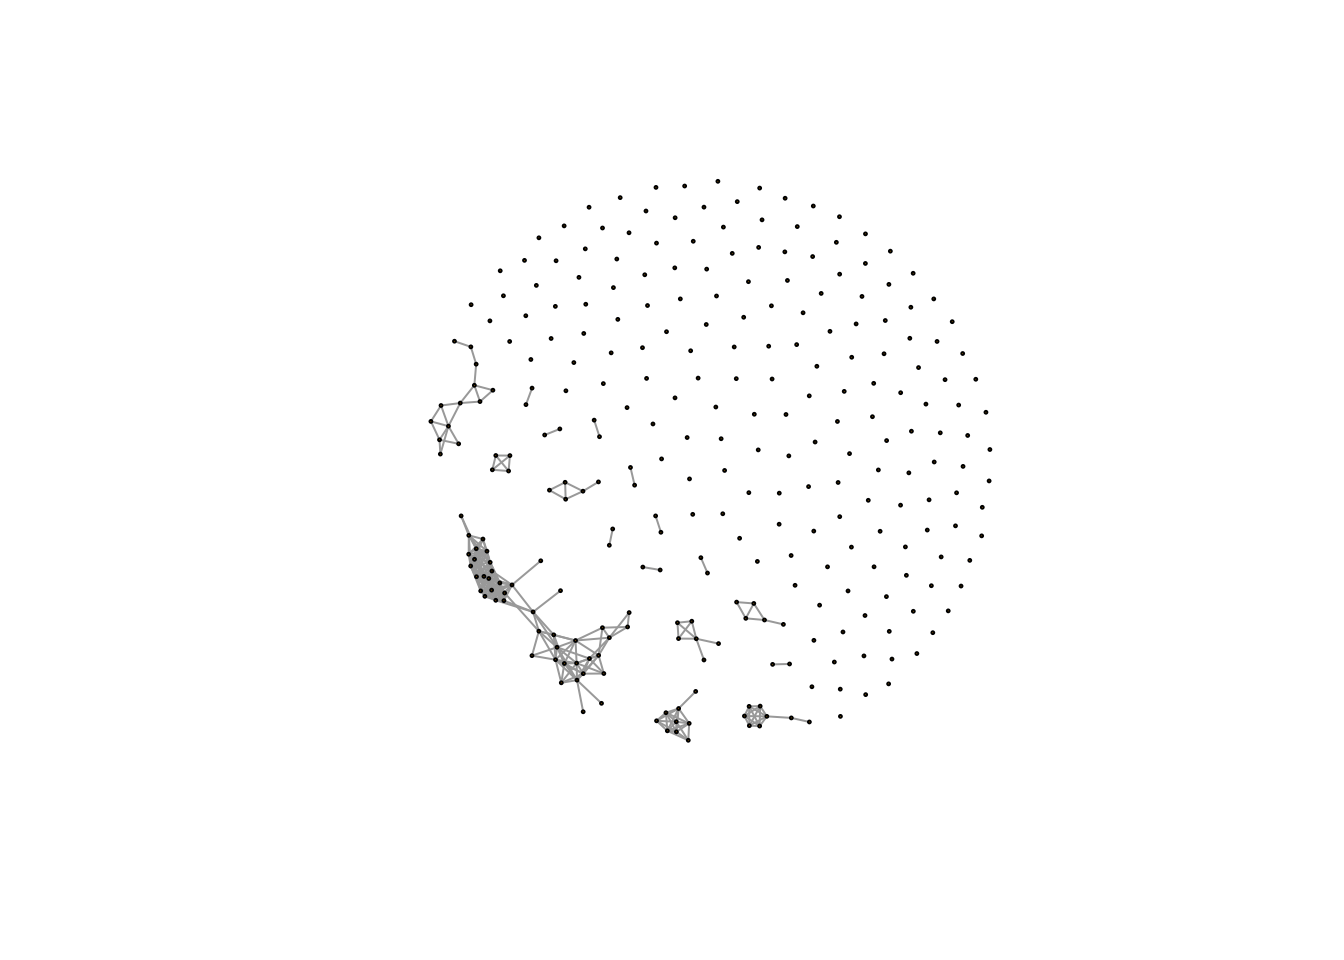
The reason to avoid using p values or adjust p values of correlation test is not only the slow speed of computation, but also cutoff selection of p values or adjust p values is determined by the researcher instead of the data themselves. p value cutoff will not help us to find biological functional modules when all the metabolites are connected. In my opinion, each data sets can speak for itself by an automated cutoff selection process and I think the network cluster numbers can just take this job.
PS. I actually use the same idea to generate PMD metabolites network, which can be treated as another relation among metabolites with chemical meanings.