Recently, I received multiple requests of reactomics analysis for MS only data such as FT-ICR MS or MS imaging data. In this case, it’s better to summary the answer with an example as reference. Here you are!
When retention time is not provided, m/z vector can still be used to check reaction level changes. To apply this analysis, you need to install the devel version(>=0.2.6) of PMD package:
remotes::install_github('yufree/pmd')## Using github PAT from envvar GITHUB_PAT. Use `gitcreds::gitcreds_set()` and unset GITHUB_PAT in .Renviron (or elsewhere) if you want to use the more secure git credential store instead.## Downloading GitHub repo yufree/pmd@HEAD##
## ── R CMD build ─────────────────────────────────────────────────────────────────
## * checking for file ‘/private/var/folders/nj/68q18qjd2x1cb8my282c58cr0000gn/T/Rtmpx52AfQ/remotes44f5531ee188/yufree-pmd-87e8de1/DESCRIPTION’ ... OK
## * preparing ‘pmd’:
## * checking DESCRIPTION meta-information ... OK
## * checking for LF line-endings in source and make files and shell scripts
## * checking for empty or unneeded directories
## * building ‘pmd_0.2.6.tar.gz’You can still use getrda to find the high frequency PMDs.
library(pmd)
data(spmeinvivo)
# get the m/z
mz <- spmeinvivo$mz
# get the m/z intensity for all m/z, the row order is the same with mz
insms <- spmeinvivo$data
# check high frequency pmd
sda <- getrda(mz)
## 164462 pmd found.## 20 pmd used.colnames(sda)## [1] "0" "1.001" "1.002" "1.003" "1.004" "2.015" "2.016"
## [8] "14.015" "17.026" "18.011" "21.982" "28.031" "28.032" "44.026"
## [15] "67.987" "67.988" "88.052" "116.192" "135.974" "135.975"# save them as numeric vector
hfpmd <- as.numeric(colnames(sda))Then getpmddf function can be used to extract all the paired ions for certain PMD.
# get details for certain pmd
pmddf <- getpmddf(mz,pmd=18.011,digits = 3)
# add intensity for all the paired ions
mz1ins <- insms[match(pmddf$ms1,mz),]
mz2ins <- insms[match(pmddf$ms2,mz),]
# get the pmd pair intensity
pmdins <- mz1ins+mz2ins
# get the pmd total intensity across samples
pmdinsall <- apply(pmdins,2,sum)
# show the PMD intensity
pmdinsall
## 1405_Fish1_F1 1405_Fish1_F2 1405_Fish1_F3 1405_Fish2_F1 1405_Fish2_F2
## 9898514 7801273 10363201 5847334 10479551
## 1405_Fish2_F3 1405_Fish3_F1 1405_Fish3_F2 1405_Fish3_F3
## 7021375 10584976 12989961 12559649You can also calculate the static or dynamic PMD intensity for m/z only data.
# get the ratio of larger m/z over smaller m/z
ratio <- mz2ins/mz1ins
# filter PMD based on RSD% across samples
# cutoff 30%
cutoff <- 0.3
# get index for static PMD
rsdidx <- apply(ratio,1,function(x) sd(x)/mean(x)<cutoff)
# get static PMD
pmddfstatic <- pmddf[rsdidx,]
# get static intensity
pmdinsstatic <- pmdins[rsdidx,]
# normalize the ions pair intensity to avoid influences from large response factors
pmdinsstaticscale <- t(scale(t(pmdinsstatic)))
# get the pmd static intensity across samples
pmdinsstaticall <- apply(pmdinsstaticscale,2,sum)
# show the PMD static intensity for each sample
pmdinsstaticall
## 1405_Fish1_F1 1405_Fish1_F2 1405_Fish1_F3 1405_Fish2_F1 1405_Fish2_F2
## 1.027 -16.704 2.374 -27.241 12.434
## 1405_Fish2_F3 1405_Fish3_F1 1405_Fish3_F2 1405_Fish3_F3
## -17.758 7.924 19.803 18.142# get index for dynamic PMD
rsdidx <- apply(ratio,1,function(x) sd(x)/mean(x)>=cutoff)
# get dynamic PMD
pmddfdynamic <- pmddf[rsdidx,]
# get dynamic intensity for ms1 and ms2
pmdinsdynamicms1 <- apply(mz1ins[rsdidx,],1,function(x) sd(x)/mean(x))
pmdinsdynamicms2 <- apply(mz2ins[rsdidx,],1,function(x) sd(x)/mean(x))
# find the stable ms and use ratio as intensity
idx <- pmdinsdynamicms1>pmdinsdynamicms2
pmdinsdynamic <- ratio[rsdidx,]
pmdinsdynamic[idx,] <- 1/ratio[rsdidx,][idx,]
# get the pmd dynamic intensity across samples
pmdinsdynamicall <- apply(pmdinsdynamic,2,sum)
# show the PMD dynamic intensity for each sample
pmdinsdynamicall## 1405_Fish1_F1 1405_Fish1_F2 1405_Fish1_F3 1405_Fish2_F1 1405_Fish2_F2
## 374.2 315.6 388.0 207.8 233.4
## 1405_Fish2_F3 1405_Fish3_F1 1405_Fish3_F2 1405_Fish3_F3
## 199.9 283.5 328.0 256.2You can also use getpmddf function extract all the paired ions for multiple PMDs. Then you could generate the network based on the output.
# get details for certain pmd
pmddf <- getpmddf(mz,pmd=hfpmd,digits = 3)
# viz by igraph package
library(igraph)
##
## Attaching package: 'igraph'## The following objects are masked from 'package:stats':
##
## decompose, spectrum## The following object is masked from 'package:base':
##
## unionnet <- graph_from_data_frame(pmddf,directed = F)
pal <- grDevices::rainbow(length(unique(E(net)$diff2)))
plot(net,vertex.label=NA,vertex.size = 5,edge.width = 3,edge.color = pal[as.numeric(as.factor(E(net)$diff2))],main = 'PMD network')
legend("topright",bty = "n",
legend=unique(E(net)$diff2),
fill=unique(pal[as.numeric(as.factor(E(net)$diff2))]), border=NA,horiz = F)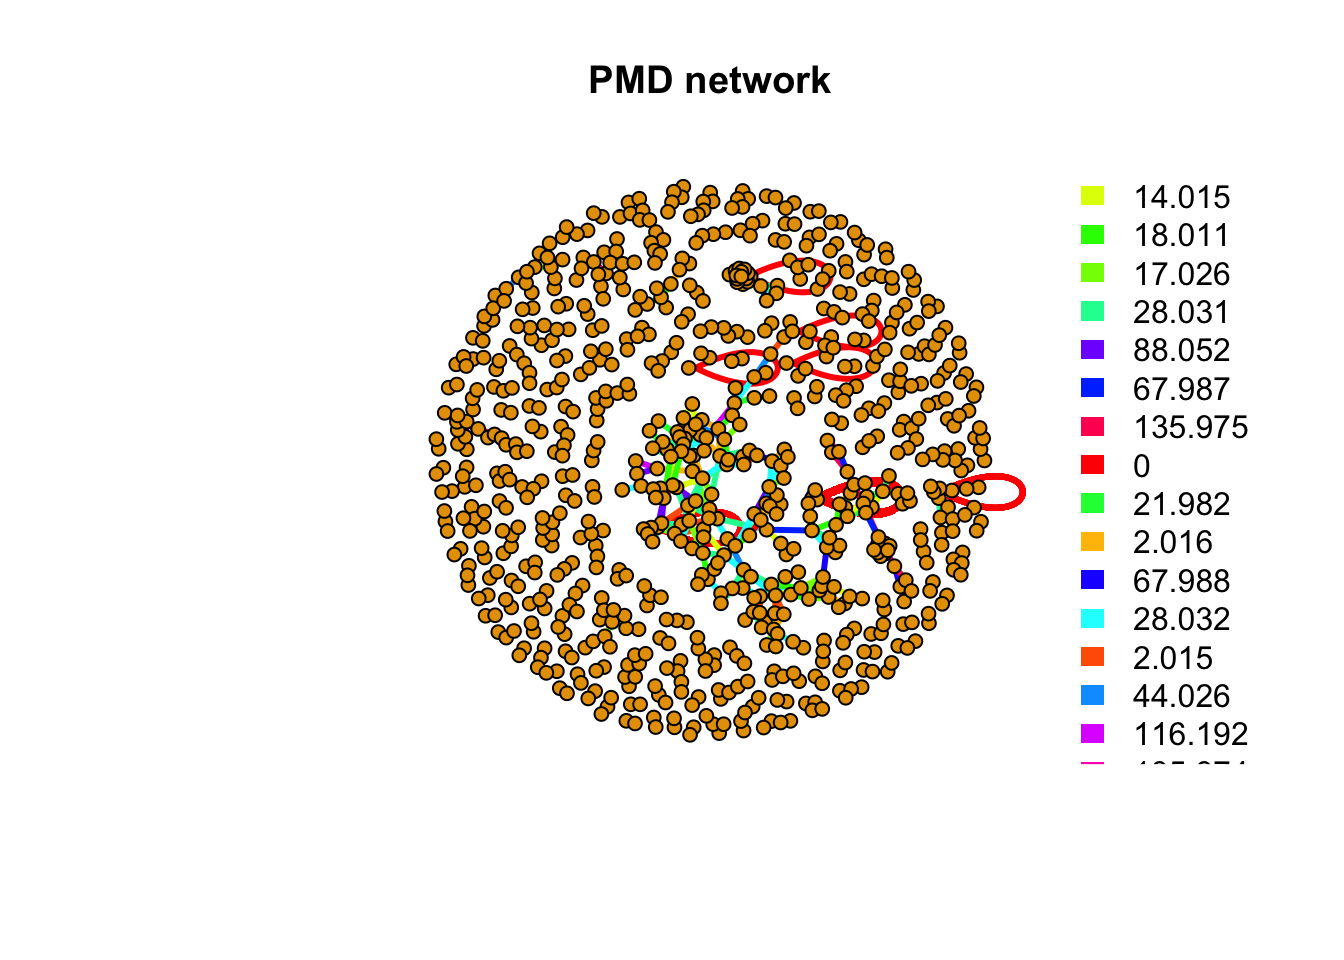
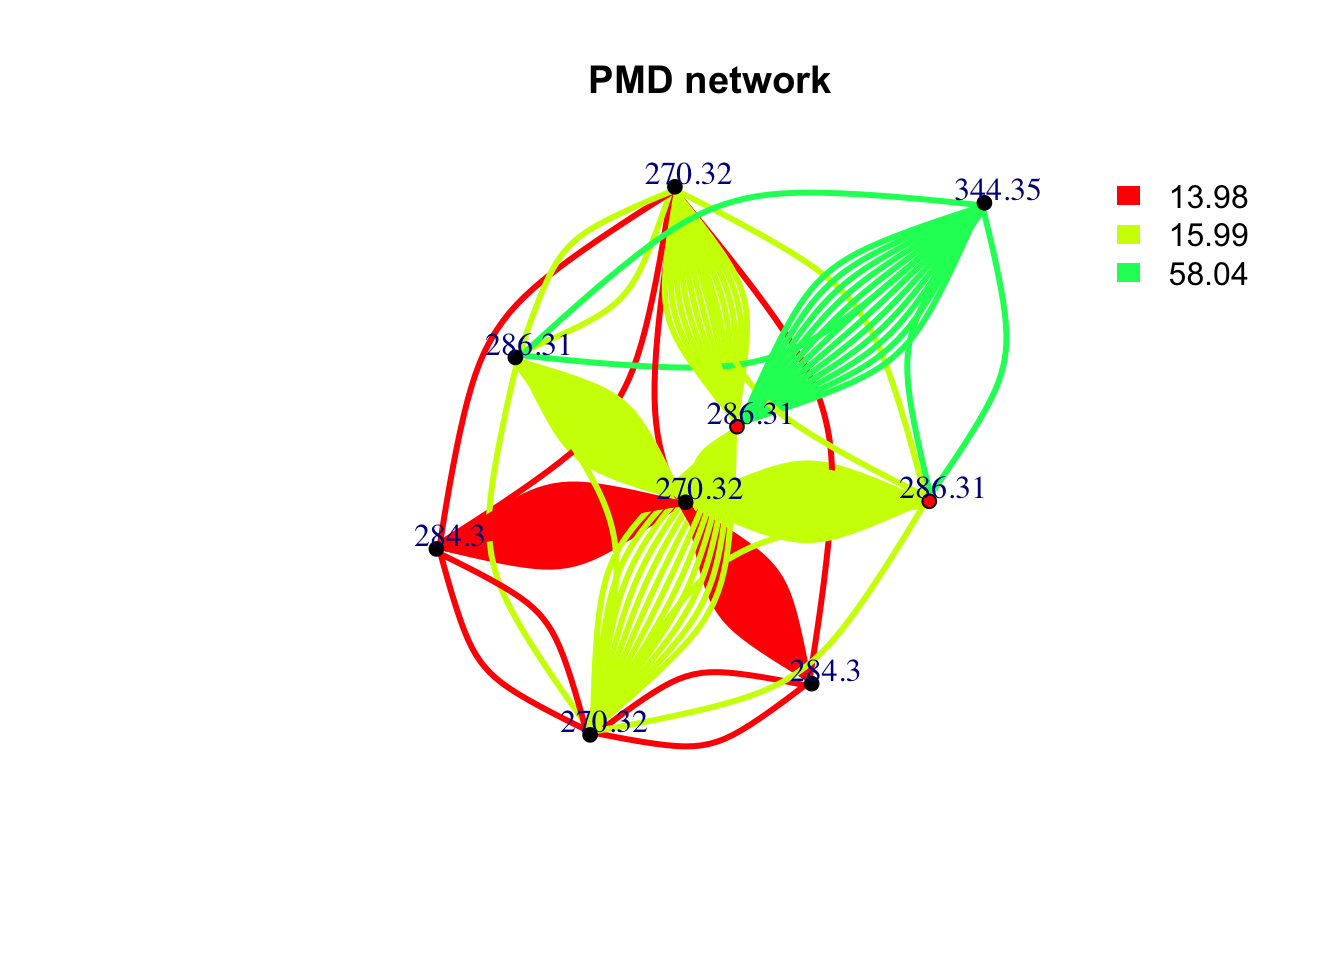
If you prefer to get a pmd network for a specific mass. You can still use getchain function.
data(spmeinvivo)
spmeinvivo$rt <- NULL
chain <- getchain(spmeinvivo,diff = c(2.02,14.02,15.99,58.04,13.98),mass = 286.3101,digits = 2,corcutoff = 0)
# show as network
net <- graph_from_data_frame(chain$sdac,directed = F)
pal <- grDevices::rainbow(5)
plot(net,vertex.label=round(as.numeric(V(net)$name),2),vertex.size =5,edge.width = 3,edge.color = pal[as.numeric(as.factor(E(net)$diff2))],vertex.label.dist=1,vertex.color=ifelse(round(as.numeric(V(net)$name),4) %in% 286.3101,'red','black'), main = 'PMD network')
legend("topright",bty = "n",
       legend=unique(E(net)$diff2),
       fill=unique(pal[as.numeric(as.factor(E(net)$diff2))]), border=NA,horiz = F)