When we talk about biomarker in metabolomics, most of people refer to certain compound. When this ‘magic’ compound show different concentrations between control and treatment group, we could find some evidence of diseases or disorders. In a regular workflow, chemist detect compounds from mass spectrumetry peaks and biologist found the the connections between compounds. That is:
peaks -> compounds -> connections among compounds
Analytical chemist spent too much energy to make annotations for peaks, pack them into a compound list and send the list to biologist. Interesting, biologist would also spend a lot of time to explain why those compounds could appear at the same time. Well, let’s have a rest and visit the museum.
How to explain a painting? I am not an artist. However, if I see a painting above, I am not really care about what is the name of all the person in the scene. I do care the relationship among those people. You could see couples, friends, family members … Wait a moment, how could you find those relationships?
The answer is distance. People could be grouped by paired distances. Similar thing happened in metabolomics: when we collect peaks from mass spectrumetry, we actually capture a snapshot of all compounds with their paired chemical reaction relationship. For example, when we see two compounds show a mass distance of 16, those two compounds might be involved in xenbiotics Phase I reactions such as hydrolysis, reduction and oxidation. If a lot of paired compounds show this relationship, we could use the sum of their intensity to stand for certain reactions for further discussion.
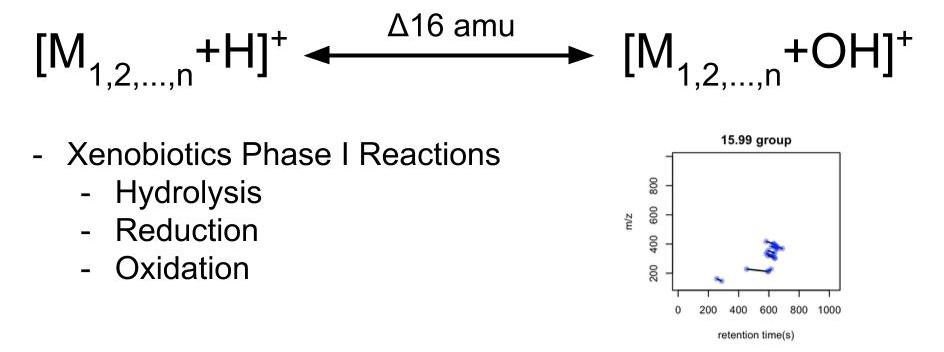
In this case, mass spectrum was used as a tool to measure reactions instead of compounds. If certain paired mass distances show a high frequency in one data set, we might treat those bunch of compounds as representative of certain reactions. Then we could go back to check what happened of those ‘reactions’ between different groups. Yes, here we could skip the annotation and directly make quantitative analysis at reactions level. This is concept of biomaker reactions.
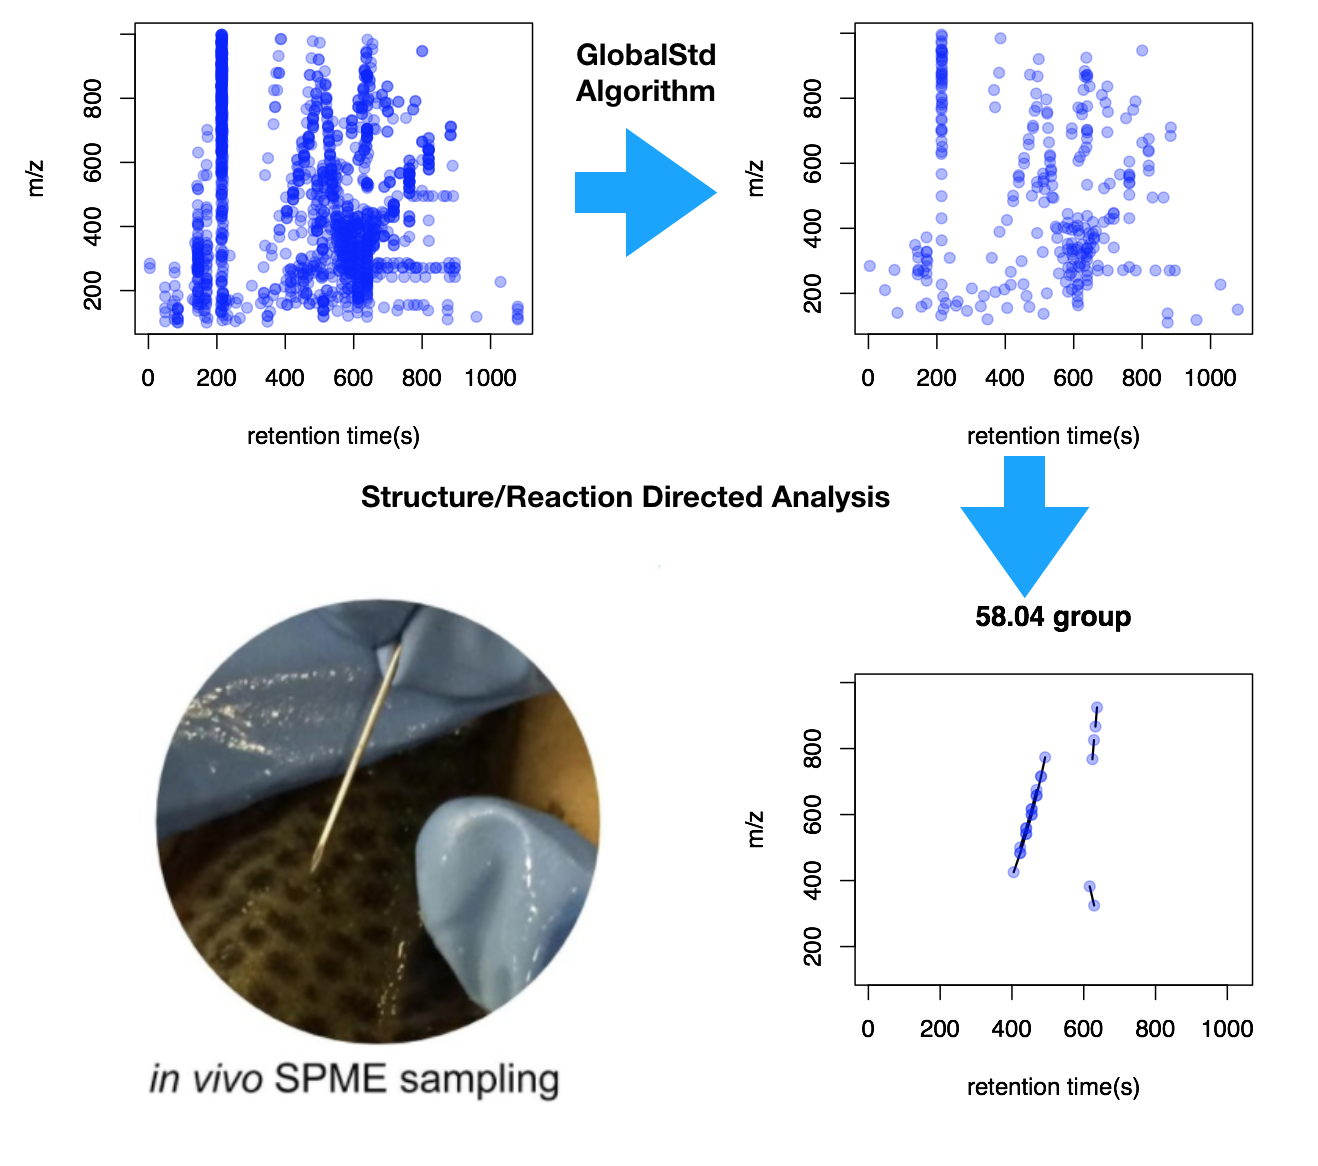
Actually I just published this concept as reaction directed analysis on ACA. Last week, the corresponding R package pmd was on CRAN. I put demo data along with a shiny application in this package. Also I wrote a website to show the usage of this package. You could connect this analysis with xcms package.
To perform the reaction directed analysis, two step is necessary. The first step is find independent peaks from the peaks list by removing adducts, isotopes and neutral loss. In pmd package, I developed GlobalStd algorithm to rule out those peaks in an untargeted way without pre-defined list. The second step is perform reaction directed analysis based on paired mass distance based on frequency analysis. This package is still under active development and more features would come soon.
Next time when you consider biomarker, recall the painting and reactions. Then use your mass spectrometry as reaction discoverer.
Peaks ->
Compounds-> Relationship among compounds